Transactional Outbox: Retry and Monitoring

The first outbox article ended where most outbox write-ups end: the event is in the same transaction as the order, a relay drains the table, and if publishing fails "the event is still in your database and will be retried". It gave retries one sentence — after N attempts, move the row to a failed table — and monitoring none.
That sentence hides most of the production work. Retried by whom, when, how many times, and what counts as a time? What happens to the order's paid event while its placed event is retrying? How do you tell, from a dashboard at three in the morning, that the relay is fine and the outbox is merely busy — or that the relay died at midnight and nobody has written an order since?
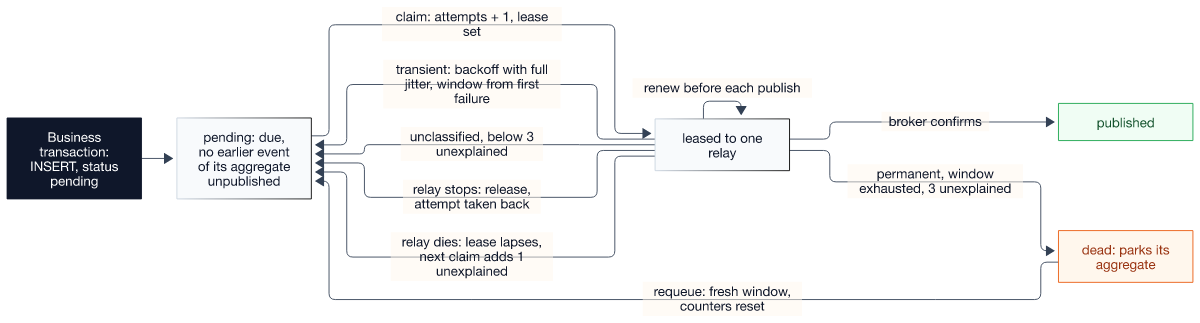
This article is the other half. It keeps the table and the polling relay from part one and adds what they need to survive a real broker: a lease instead of a held lock, failures sorted into three kinds with three different budgets, backoff with full jitter bounded by time rather than by count, per-aggregate ordering that a stuck event cannot break, dead letters with a way back, and the eleven metrics and six alerts that tell you whether any of it is working.
The contract, stated once so the rest can be read against it. Every event the business transaction commits is either published, confirmed by the broker; dead, with a reason a person can read; or held behind a dead event of its own aggregate, waiting for that person — and the monitoring reports all three. Nothing is silently lost, and nothing is retried forever. Delivery is at-least-once: duplicates happen, carry the same event id, and are the consumer's to drop. Order holds per aggregate, provided the writers of one aggregate are serialised, which the writer below does itself; there is no global order and no exactly-once. And the outbox's health is one number — the age of the oldest unpublished event — plus the diagnostics that explain it.
Everything runs. The demo is plain PHP on PHP 8.6.0RC4 with PDO and PostgreSQL 18.6, no framework, a scripted in-memory broker, and every mechanism below has a test that fails without it:
phpunit          40 tests, 165 assertions, against a real PostgreSQL 18.6
pint             26 files, clean
promtool         /metrics output lints clean; 6 alert rules, 8 rule-test scenarios pass
mutations        29 mechanisms removed one at a time: 28 turn the suite red, 1 is equivalent
The code is at michalwolinski/transactional-outbox-retry-and-monitoring, ./run.sh reproduces all of the above except the mutations, which mutations/run.py runs, and every code block in this article is a real file in that repository. The consumer side — deduplicating the duplicates this relay will produce — is the inbox pattern, and this article does not repeat it.
The columns retry and monitoring need
Part one's table had a processed_at and nothing else to say about a row's life. Retry and monitoring each need a few more facts per row, and it is worth seeing them together before the code that uses them:
-- database/schema.sql
CREATE TABLE outbox (
    id                   BIGINT GENERATED ALWAYS AS IDENTITY PRIMARY KEY,
    event_id             UUID        NOT NULL DEFAULT uuidv7() UNIQUE,
    aggregate_id         TEXT        NOT NULL,
    event_type           TEXT        NOT NULL,
    payload              JSONB       NOT NULL,
    status               TEXT        NOT NULL DEFAULT 'pending'
                         CHECK (status IN ('pending', 'published', 'dead')),
    created_at           TIMESTAMPTZ NOT NULL DEFAULT now(),

    -- Retry state. attempts counts claims, not failures: a relay that dies mid-publish never
    -- reaches its catch block, and the attempt still has to count.
    attempts             INT         NOT NULL DEFAULT 0,
    -- Attempts that told us nothing: the relay never came back (lease expired), or it came back
    -- with an exception nobody classified. Small limit, then dead.
    unexplained_failures INT         NOT NULL DEFAULT 0,
    -- Start of the retry window: the first failure, not the insert. An event that waited a day
    -- behind a stopped relay has not been failing for a day. NULL until something fails, and
    -- NULL again after a requeue.
    retry_since          TIMESTAMPTZ,
    next_attempt_at      TIMESTAMPTZ NOT NULL DEFAULT now(),
    last_error           TEXT,

    -- The lease. A claim is a short committed UPDATE, not a row lock held across the network call.
    locked_by            TEXT,
    locked_until         TIMESTAMPTZ,

    published_at         TIMESTAMPTZ,
    dead_at              TIMESTAMPTZ
);
Three choices in there matter later. Dead rows stay in the table, with status = 'dead', instead of moving to a separate outbox_failed table as part one suggested. A row that moves away stops blocking anything, and the ordering rule below depends on a dead event blocking its own aggregate. The event id is generated by the database — uuidv7() is built into PostgreSQL 18 — so it exists from the moment the row does and sorts by time. And every time comparison uses the database clock: two relays on two hosts with skewed clocks still agree on whether a lease has expired or a retry is due.
Two partial indexes keep the hot paths away from the published history, which is most of the table:
-- database/schema.sql
-- The relay's hot path: rows that can still be claimed, in the order they are due.
CREATE INDEX outbox_due ON outbox (next_attempt_at, id) WHERE status = 'pending';

-- Everything not yet published, per aggregate: the ordering check and the health query read this,
-- and neither has to touch the published history.
CREATE INDEX outbox_unpublished ON outbox (aggregate_id, id) WHERE status <> 'published';
A test inserts 200,000 published rows next to two pending ones, runs ANALYZE, and asserts that neither the claim nor the health query plan contains a Seq Scan. Dropping the WHERE o.status <> 'published' from the health query is one of the mutations, and that test is what kills it.
Claim with a lease, not a lock
Part one's polling relay selected rows FOR UPDATE SKIP LOCKED, published them, and updated them. The natural way to make that safe is to wrap it in a transaction — and then the row lock, the transaction and a pooled connection are all held for as long as the broker takes to answer. Under a broker that is slow rather than down, that is the worst shape: every relay is busy holding locks, long transactions hold back vacuum, and a crash rolls back the bookkeeping of messages the broker already has.
The alternative is a lease. Claiming is one short statement that locks the due rows just long enough to stamp them with an owner and an expiry, and commits. What survives the commit is not a lock but two columns: locked_by and locked_until. Other relays skip the row until the lease runs out. A relay that dies mid-publish gives the row back by doing nothing at all.
// src/OutboxStore.php
    public const string CLAIM_SQL = <<<'SQL'
        WITH due AS (
            SELECT o.id
            FROM outbox o
            WHERE o.status = 'pending'
              AND o.next_attempt_at <= now()
              AND (o.locked_until IS NULL OR o.locked_until < now())
              -- Per-aggregate order: nothing goes out while an earlier event of the same
              -- aggregate is still pending or dead.
              AND NOT EXISTS (
                  SELECT 1
                  FROM outbox earlier
                  WHERE earlier.aggregate_id = o.aggregate_id
                    AND earlier.id < o.id
                    AND earlier.status <> 'published'
              )
            ORDER BY o.next_attempt_at, o.id
            LIMIT :limit
            FOR UPDATE SKIP LOCKED
        )
        UPDATE outbox AS o
        SET attempts             = o.attempts + 1,
            -- A lease that is still set was never released: the last claimer died or ran
            -- out of time. That attempt counts, and it explains nothing.
            unexplained_failures = o.unexplained_failures
                                   + CASE WHEN o.locked_by IS NULL THEN 0 ELSE 1 END,
            locked_by            = :relay_id,
            locked_until         = now() + make_interval(secs => CAST(:lease AS integer))
        FROM due
        WHERE o.id = due.id
        RETURNING o.id, o.event_id, o.aggregate_id, o.event_type, o.payload, o.attempts,
                  o.unexplained_failures,
                  extract(epoch FROM now() - coalesce(o.retry_since, now()))::bigint AS retry_age_seconds
        SQL;
The relay then publishes each claimed row with no transaction open, and records the verdict in a second short transaction. The test for "no lock is held while the broker is called" is direct: the scripted broker, in the middle of publishing, opens a second connection and asks for the same row FOR UPDATE NOWAIT. If the relay held a transaction across the call, NOWAIT would throw. It gets the row.
Every verdict is conditional on still holding the lease — WHERE id = :id AND locked_by = :relay_id — and the verdict and its counter are written together:
// src/OutboxStore.php
    private function transition(OutboxMessage $message, string $relayId, Counter $counter, string $sql, array $parameters = []): bool
    {
        $this->pdo->beginTransaction();

        try {
            $statement = $this->pdo->prepare($sql);
            $statement->execute(['id' => $message->id, 'relay_id' => $relayId, ...$parameters]);
            $moved = 1 === $statement->rowCount();

            // An upsert, so a relay that has not beaten yet still has its verdict counted.
            $column = $moved ? $counter->value : Counter::LeaseLost->value;
            $this->pdo->prepare(<<<SQL
                INSERT INTO outbox_relay (relay_id, {$column}) VALUES (:relay_id, 1)
                ON CONFLICT (relay_id) DO UPDATE SET {$column} = outbox_relay.{$column} + 1
                SQL)->execute(['relay_id' => $relayId]);

            $this->pdo->commit();
        } catch (Throwable $exception) {
            $this->pdo->rollBack();

            throw $exception;
        }

        return $moved;
    }
Zero rows updated means the lease is gone: the relay was slower than its lease and another relay has taken the row over. If the late verdict is a success, the event has now gone out twice; if it is a failure, the timed-out publish may or may not have reached the broker, and the new owner is sending it again regardless. That is not an error to throw — the second relay will finish the job — but it is two relays working one row, so it is counted as lease_lost and later alerted on. A crashed relay never shows up in that counter: it sends no verdict at all, and the next claim records it as an unexplained failure instead.
The owner check earns its keep on the failure path, not the success path. A relay whose broker call times out after its lease has already passed to someone else would, without it, write locked_by = NULL over a row the second relay is still publishing — and a third relay could claim and publish it too. The test for that claims as relay-a, lets the lease lapse, claims as relay-b, reports a late failure from relay-a, and asserts the row is still relay-b's and invisible to relay-c. On a late success the check turns out not to matter, which the mutation run found before I did: either owner's mark leaves the same duplicate and the same counts. That mutant survives, and the README explains why it is the one that is allowed to.
The lease is the one number in this design that has to be chosen against the broker rather than against the business, and the easy mistake is to stamp it once, at claim time. Rows are claimed as a batch and published one after another, so the hundredth row of a batch is published after ninety-nine others — and with a 30-second lease and a half-second publish, rows 61 to 100 would lapse before the relay reached them. Another relay would take them, both would publish them, and each takeover would count as an unexplained failure against a perfectly healthy event. So before every publish the relay renews the lease on every row of the batch it still holds:
// src/Relay.php
        $batch = $this->store->claim($this->relayId, $this->batchSize, $this->lease);
        $unsettled = array_map(static fn (OutboxMessage $message): int => $message->id, $batch);

        foreach ($batch as $message) {
            if (null !== $shouldStop && $shouldStop()) {
                $this->store->release($this->relayId, $unsettled);

                break;
            }

            $report->claimed++;
            $held = $this->store->renew($this->relayId, $unsettled, $this->lease);
            $unsettled = array_values(array_diff($unsettled, [$message->id]));

            // Taken over while earlier rows of the batch were being published. Skipping it is the
            // one case where a lapsed lease costs nothing: the new owner publishes it, once.
            if (false === in_array($message->id, $held, true)) {
                continue;
            }
Now the lease has to outlast one publish, not a batch of them, and a row that was taken over anyway is skipped rather than published twice. (The $shouldStop check at the top of the loop is the subject of the next section.) The renewal also writes the heartbeat, which matters for the monitoring below: a relay working through a long batch keeps reporting itself alive instead of going quiet for the whole pass. The test publishes three rows at 20 seconds each against a 30-second lease, has a second relay try to steal the third row 40 seconds in, and asserts it gets nothing. The lease_lost counter now means what it says — a single publish slower than the lease.
And the lease makes the at-least-once guarantee concrete. The test that kills a relay between the broker's confirm and the UPDATE ends with the broker holding the same event twice:
// tests/RelayTest.php
    #[Test]
    public function a_relay_that_dies_between_publish_and_mark_causes_a_duplicate_with_the_same_event_id(): void
    {
        $eventId = $this->append('order-1');

        // relay-a gets as far as the broker confirm, then the process is killed.
        foreach ($this->store->claim('relay-a', 10, self::lease()) as $message) {
            $this->broker->publish($message);
        }

        $this->wait(31);
        $this->relay('relay-b')->runOnce();

        $this->assertSame([$eventId, $eventId], $this->broker->publishedEventIds());
        $this->assertSame('published', $this->statusOf($eventId));
    }
No arrangement of the relay removes that duplicate; the broker and the database cannot commit together. What the relay can do is make the duplicate recognisable — the same event_id both times — and that is the key the consumer's inbox deduplicates on. A note on wait(31): tests do not sleep. The helper moves every timestamp in both tables 31 seconds into the past, which is indistinguishable from waiting, because the code under test only ever compares them with the database's now().
Count the attempt when you claim it
The obvious place to increment an attempt counter is the catch block: publish failed, attempts++. That misses the failure that matters most. An event whose payload makes the relay run out of memory, or segfault an extension, or hang until the orchestrator kills the pod, never reaches the catch. It is claimed, the process dies, the lease expires, another relay claims it, and that one dies too. Counted in the catch, this event has zero failed attempts forever, and it takes down every relay that touches it.
So the claim does the counting: attempts = o.attempts + 1 happens in the same statement that hands the row out. And the claim also notices the one fact a dead relay leaves behind — a lease that was never released. If locked_by is still set when a row is claimed, the previous claimer neither published nor failed; it just stopped. That increments unexplained_failures.
The policy checks that counter before calling the broker, so the event that keeps killing relays is dead-lettered by the relay that would otherwise have been its next victim:
// tests/RelayTest.php
    #[Test]
    public function an_event_that_keeps_killing_the_relay_is_dead_lettered_before_the_broker_sees_it_again(): void
    {
        $eventId = $this->append('order-1');

        // Three relays in a row claim it and never come back (an OOM kill on a huge payload, say).
        foreach (['relay-a', 'relay-b', 'relay-c'] as $doomed) {
            $this->store->claim($doomed, 10, self::lease());
            $this->wait(31);
        }

        $this->relay('relay-d')->runOnce();

        $row = $this->row($eventId);
        $this->assertSame('dead', $row['status']);
        $this->assertSame(4, $row['attempts']);
        $this->assertSame(3, $row['unexplained_failures']);
        $this->assertSame([], $this->broker->published);
    }
There is a cost, and it is the same cost as the lease: a relay that was merely slow — still waiting on the broker when its lease ran out — looks exactly like one that died, and its row collects an unexplained failure on the next claim. That is deliberate. From the row's point of view both are "an attempt with no verdict", and the fix for either is the same: find out what is slow or what is dying. The lease_lost counter tells the two apart after the fact; the row does not need to.
The same counter has a trap that only shows up on deploy day. A relay that is shut down mid-batch — a rolling restart sends it SIGTERM — and simply exits looks exactly like one that died: every row it had claimed and not yet published lapses, and the next claim records an unexplained failure against each. Worse, those rows are claimed first again, because nothing about them changed and the claim orders by next_attempt_at, id. Restart three replicas one after another during a backlog and the same oldest events collect three unexplained failures and go to the dead letters, healthy, having never been tried. A process that was asked to stop is not a process that died, so it says so: the relay checks a $shouldStop callback before every publish — wire it to SIGTERM — finishes the publish it is in, and releases the rest of its batch, taking back the attempt each claim counted. The test restarts three relays in a row against the same two events, a lease apart, and asserts both are published and nothing is dead; with the release removed, the oldest event is dead after the third restart.
Three kinds of failure, three budgets
"Retry N times" treats every failure as the same kind of evidence. They are not. A connection refused says nothing about the message and everything about the broker. A 413 Payload Too Large says everything about the message and will say it again on every attempt. An exception nobody anticipated says nothing useful about either.
The broker adapter is where that knowledge lives, so the adapter's contract is the classification, not just the call:
// src/Broker/Broker.php
interface Broker
{
    /**
     * Returns only once the broker has confirmed the message (publisher confirm, acks=all, a 2xx
     * from the API). Returning earlier turns "published" into "handed to a socket".
     *
     * @throws TransientPublishFailure the broker may take this message later: unreachable,
     *                                 timed out, throttled, failing over
     * @throws PermanentPublishFailure the broker will never take this message: rejected payload,
     *                                 unroutable, too large, not authorised for this topic
     */
    public function publish(OutboxMessage $message): void;
}
The first line of that docblock is easy to skip and is a correctness requirement: publish() returns only after the broker has confirmed. A RabbitMQ channel without publisher confirms, or a Kafka producer with acks=0, "succeeds" when the bytes hit a socket buffer, and the outbox marks as published an event the broker may never have stored. Everything downstream of that is retry logic for a message nobody will ever retry.
The adapter should also hand the event id to the broker as the message's own id, because some brokers can then drop the relay's duplicates before any consumer sees them — and the details decide how much that buys. An SQS FIFO queue deduplicates on MessageDeduplicationId within a five-minute window, which covers a relay that died between the confirm and the mark and was replaced within minutes. Kafka's idempotent producer does not help here at all: it removes duplicates from its own retries, and its documentation is explicit that it can only do so for messages sent within a single session — a relay restart is a new one. RabbitMQ's classic and quorum queues do not deduplicate; the message_id property is for the consumer. None of them replaces the inbox; the first one makes it work less.
Each kind then gets the budget that fits what it tells you:
| failure | examples | what it means | budget |
|---|---|---|---|
| permanent | schema rejected, too large, unroutable, forbidden | the message is the problem | none — dead on the first failure |
| transient | refused, timeout, throttled, leader election | the broker is the problem | a time window: 24 hours by default |
| unexplained | an unclassified exception; a claim that never came back | nobody knows | a small count: 3 |
// src/Retry/RetryPolicy.php
    public function afterFailure(OutboxMessage $message, Throwable $failure): Decision
    {
        $error = sprintf('%s: %s', $failure::class, $failure->getMessage());

        if ($failure instanceof PermanentPublishFailure) {
            return Decision::deadLetter($error);
        }

        if ($failure instanceof TransientPublishFailure) {
            if (0 <= Duration::compare($message->retryAge, $this->retryWindow)) {
                return Decision::deadLetter(sprintf('retry window of %ds exhausted; last error %s', $this->retryWindow->seconds, $error));
            }

            return Decision::retry($this->delay($message->attempts), $error);
        }

        if ($message->unexplainedFailures + 1 >= $this->maxUnexplainedFailures) {
            return Decision::deadLetter(sprintf('gave up after %d unexplained failures; last error %s', $message->unexplainedFailures + 1, $error));
        }

        return Decision::retry($this->delay($message->attempts), $error, unexplained: true);
    }
Retrying a permanent failure is not harmless caution. Under per-aggregate ordering, every retry of the rejected order.placed is time during which that order's order.paid cannot go out either. Dead-lettering it on the first failure is what gets a human looking at it while the problem is still one event wide.
The unexplained bucket is the honest middle. Treating an unknown exception as permanent would dead-letter healthy events en masse the day an SDK upgrade introduces a new network exception class; treating it as transient would retry a genuine bug for a day. A small count does neither, and the dead-letter reason names the exception class, which is usually all it takes to move it into one of the other two buckets in the adapter.
A word on the types: every duration here — base delay, cap, window, lease, retry age — is a Time\Duration, new in PHP 8.6 (covered here). In code that is mostly arithmetic on time, multiplyBy() and Duration::compare() read the way the policy does, and an int $seconds next to an int $attempts was exactly the parameter pair that swaps silently. One sharp edge: a static call is not a constant expression, so Duration::fromMinutes(5) cannot be a parameter default.
Backoff with full jitter, bounded by time
For transient failures the delay grows exponentially and is capped — base · 2^(attempt − 1), at most five minutes — and then the actual delay is drawn uniformly between zero and that ceiling:
// src/Retry/RetryPolicy.php
    /**
     * Full jitter: anywhere between zero and the ceiling. Not ceiling ± 10% — after an outage every
     * row failed in the same second, and a narrow jitter keeps them in the same few seconds.
     */
    public function delay(int $attempt): Duration
    {
        return Duration::fromSeconds($this->random->getInt(0, $this->ceiling($attempt)->seconds));
    }

    /**
     * base · 2^(attempt − 1), capped. Attempt 1 waits up to base, attempt 2 up to 2·base, …
     */
    public function ceiling(int $attempt): Duration
    {
        $uncapped = $this->baseDelay->multiplyBy(2 ** min(max($attempt - 1, 0), 30));

        return 0 < Duration::compare($uncapped, $this->maxDelay) ? $this->maxDelay : $uncapped;
    }
Why the whole range rather than a small wobble around the ceiling: after an outage, every row in the outbox failed at roughly the same moment and is on roughly the same attempt. With no jitter they all come back in the same second, and the broker that just recovered meets the entire backlog at once. The test feeds a thousand rows on their ninth attempt (ceiling 256 seconds) through a seeded randomizer: without jitter, all thousand retry at second 256; with full jitter they land on 253 different seconds and the busiest second gets 10.
The more consequential decision is what bounds the retries. Part one said "after N retries". Here is what N means during a 15-minute broker outage, from a test that keeps the broker down until 900 seconds have passed and records when each attempt happened (the jitter is seeded, so the numbers are exact):
| attempt | 1 | 2 | 3 | 4 | 5 | 6 | 7 | 8 | 9 | 10 | 11 | 12 | 13 |
|---|---|---|---|---|---|---|---|---|---|---|---|---|---|
| seconds into the outage | 0 | 1 | 3 | 6 | 11 | 22 | 46 | 95 | 152 | 259 | 374 | 611 | 839 |
The broker comes back and attempt 14 succeeds. Nothing was dead-lettered. With "dead after 5 attempts", that perfectly healthy event would have been dead-lettered 11 seconds into the outage. With "after 10", at 259 seconds — under five minutes, which a broker upgrade or a zone failover can easily take. And because the jitter is random, a count limit dead-letters different events at different moments of the same outage, so the dead-letter queue after an incident is a random sample of the traffic rather than a list of broken messages.
An attempt count measures how hard you tried. An outage is measured in time. So the transient budget is a window — 24 hours from the first failure — and a test asserts the asymmetry directly: an event on its fortieth attempt, an hour into its failures, is retried; an event on its second attempt, a day into them, is dead.
"From the first failure" is the part that is easy to get wrong. Start the window at the insert — retry_since DEFAULT now() — and it measures how old the event is, not how long it has been failing, and those differ exactly when it hurts: stop the relay for a day, start it again into a one-second broker blip, and every event in the backlog dies on its first failure, because each is already a day old. So retry_since is NULL until something fails, set once by coalesce(retry_since, now()). One test waits 25 hours before the first failure and asserts the event is retried; another fails an event three times half an hour apart under a one-hour window and asserts the third failure kills it, which is what tells "from the first failure" apart from "from the latest one".
The window also has a second meaning that is easy to miss: under per-aggregate ordering it is the longest one order can stay frozen behind a retrying event before anything becomes a dead letter. Twenty-four hours is a statement about how long the broker may be down; it is also a statement that an order may wait a day without anyone being told by the dead-letter queue. The lag alert is what tells them, eleven minutes in — which is why the two have to be chosen together, and why the window can afford to be generous.
The same column handles the operator. requeue sets retry_since back to NULL, so an event put back after a fix gets a whole new window instead of dying on its first hiccup, and the events held behind it never had a window to begin with — they were waiting, not failing.
One stuck event holds its own aggregate
Ordering usually matters per aggregate and nowhere else: consumers need order.placed before order.paid for the same order, and do not care how two different orders interleave. A relay that retries out of band breaks this immediately — placed fails, goes into backoff, paid sails through, and the consumer sees a payment for an order it has never heard of.
The NOT EXISTS in the claim is the whole rule: a row is not due while any earlier row of the same aggregate is not yet published. Because "not published" includes pending, a retrying event holds back the rest of its aggregate; because it includes dead, a dead event does too. And because the check reads the table rather than relay memory, it holds across relays — a second relay cannot overtake an event the first one is holding, which is its own test.
// tests/OrderingTest.php
    #[Test]
    public function a_retrying_event_holds_back_its_own_aggregate_and_nobody_else(): void
    {
        $placed = $this->append('order-A', 'order.placed');
        $paid = $this->append('order-A', 'order.paid');
        $other = $this->append('order-B', 'order.placed');
        $this->broker->script($placed, new TransientPublishFailure('timeout'));

        $report = $this->relay()->runOnce();

        $this->assertSame(2, $report->claimed);
        $this->assertSame([$other], $this->broker->publishedEventIds());
        $this->assertSame(0, $this->row($paid)['attempts']);
    }
This is head-of-line blocking, scoped down to one aggregate, and it has two prices. Each aggregate moves at most one event per claim, so a single aggregate with a burst of events drains at one event per poll. And a dead event parks its aggregate: nothing more from that order goes out until a human acts. That is the correct behaviour — publishing paid after placed died would hand the consumer the very inconsistency ordering exists to prevent — but it turns a dead letter from "one event lost" into "one order frozen", and the monitoring has to say so. If your consumers genuinely do not need order, drop the NOT EXISTS and both prices go with it.
The rule has a hole that no relay can close. Identity ids are handed out at INSERT and become visible at COMMIT, and concurrent transactions do those two things in different orders. A slow checkout inserts placed as id 10 and has not committed; a fast payment webhook inserts paid as id 11 and commits. The relay looks for an unpublished event of that order earlier than 11, cannot see 10, and publishes paid first. The fix belongs to the writer: before inserting, it takes a transaction-scoped advisory lock on the aggregate, so the second writer of the same order waits until the first commits, and only then gets its id.
// src/OutboxWriter.php
        // Ids are handed out at INSERT and become visible at COMMIT, and those two orders differ
        // between concurrent transactions. Without this lock a slow writer's "placed" (id 10) can
        // still be uncommitted when a fast writer's "paid" (id 11) is claimed: the relay cannot
        // see 10, so 11 goes out first. Writers of one aggregate queue here until the earlier one
        // commits; writers of different aggregates almost never meet (hashtext can collide).
        // The two-key form keeps these locks in an 'outbox' namespace, apart from any other
        // advisory lock the application takes. A transaction appending for several aggregates
        // should do it in a fixed order, or two of them can deadlock (PostgreSQL aborts one).
        $this->pdo->prepare("SELECT pg_advisory_xact_lock(hashtext('outbox'), hashtext(:aggregate_id))")
            ->execute(['aggregate_id' => $aggregateId]);
Business code that already locks the order row (SELECT … FOR UPDATE, or simply updating it) before appending gets the same serialisation for free; the advisory lock makes it not depend on that. Two tests pin it down: a second writer for the same aggregate, with lock_timeout at 200 ms, fails with 55P03 while the first is open, and a writer for a different aggregate goes straight through. The lock lives until the business transaction commits, so it has the usual price of a lock: a transaction that appends for orders A and B must do so in the same order as every other such transaction, or two of them deadlock and PostgreSQL aborts one. It also uses the two-key form with an outbox namespace, so it cannot collide with an advisory lock some other part of the application takes on a number that happens to match.
Dead letters are a queue with an owner
A dead-letter table that nobody reads is a slower way of losing events. The repository ships the two operations the queue needs — look, and put back:
// src/OutboxStore.php
    /**
     * Put a dead event back. Its retry window and its unexplained failures start over, and its
     * aggregate's held events follow it out in order. last_error stays, as history.
     */
    public function requeue(string $eventId): bool
    {
        $statement = $this->pdo->prepare(<<<'SQL'
            UPDATE outbox
            SET status = 'pending', dead_at = NULL, attempts = 0, unexplained_failures = 0,
                retry_since = NULL, next_attempt_at = now()
            WHERE event_id = :event_id AND status = 'dead'
            SQL);
        $statement->execute(['event_id' => $eventId]);

        return 1 === $statement->rowCount();
    }
bin/outbox dead-letters lists each dead event with its reason and, more usefully, how many events are held behind it. last_error survives the requeue on purpose, so the history of why it died is still there if it dies again; the retrying gauge counts rows with a retry_since, not rows with an old error, so fifty requeued events do not look like a retry storm. The demo runs the whole lifecycle in real time: three orders, two transient timeouts on A placed, one schema rejection on B placed, then a requeue once "the schema is fixed". From the recorded run:
relay, until idle:
  pass 1  claimed 3, published 1, retried 1, dead-lettered 1, lease lost 0  -> C placed
  pass 2  claimed 1, published 0, retried 1, dead-lettered 0, lease lost 0
  pass 3  claimed 0, published 0, retried 0, dead-lettered 0, lease lost 0
  pass 4  claimed 1, published 1, retried 0, dead-lettered 0, lease lost 0  -> A placed
  pass 5  claimed 1, published 1, retried 0, dead-lettered 0, lease lost 0  -> A paid
  pass 6  claimed 0, published 0, retried 0, dead-lettered 0, lease lost 0
  pass 7  claimed 0, published 0, retried 0, dead-lettered 0, lease lost 0

/metrics:
  outbox_oldest_pending_age_seconds 7.112
  outbox_pending_rows 1
  outbox_retrying_rows 0
  outbox_dead_rows 1
  outbox_held_rows 1
  outbox_parked_aggregates 1
  outbox_relays_alive 1
  outbox_published_total 3
  outbox_retried_total 2
  outbox_dead_lettered_total 1
  outbox_lease_lost_total 0

dead letters:
  B placed (order-B) held=1  Outbox\Broker\PermanentPublishFailure: payload rejected by schema registry

the schema is fixed; requeue B placed:
  pass 1  claimed 1, published 1, retried 0, dead-lettered 0, lease lost 0  -> B placed
  pass 2  claimed 1, published 1, retried 0, dead-lettered 0, lease lost 0  -> B paid
Read pass 1 carefully: three claimed, not five. A paid and B paid were not due — their aggregates' first events were still unpublished. A paid follows A placed out as soon as the retry succeeds, while B paid stays put behind the dead letter until the requeue, and then follows it in order. The second /metrics block, after the requeue, is all zeros except the counters. The lag in the middle block is not zero, though nothing is "retrying" — which is the subject of the next section.
What to measure: lag, not backlog
The number most outbox dashboards show is the backlog: how many rows are unpublished. It answers the wrong question. A thousand rows written in the last second is a healthy outbox in the middle of a burst. One row that has been stuck for an hour is a consumer an hour behind reality. The backlog reads 1,000 and 1. The health test builds both situations and asserts what each number says:
// tests/HealthTest.php
    #[Test]
    public function lag_is_the_age_of_the_oldest_event_and_a_backlog_count_cannot_see_it(): void
    {
        // One event stuck for ten minutes: a backlog of one, which looks perfectly healthy.
        $this->append('order-1');
        $this->wait(600);
        $stuck = $this->health()->snapshot();

        $this->assertSame(1, $stuck->pending);
        $this->assertGreaterThanOrEqual(600.0, $stuck->oldestPendingAgeSeconds);
        $this->assertLessThan(601.0, $stuck->oldestPendingAgeSeconds);

        // A thousand events written just now, next to it: the backlog jumps, the lag does not move.
        $this->pdo->exec(<<<'SQL'
            INSERT INTO outbox (aggregate_id, event_type, payload)
            SELECT 'order-' || n, 'order.placed', '{}' FROM generate_series(2, 1001) n
            SQL);
        $burst = $this->health()->snapshot();

        $this->assertSame(1001, $burst->pending);
        $this->assertGreaterThanOrEqual(600.0, $burst->oldestPendingAgeSeconds);

        // The stuck one goes out: a backlog of a thousand that looks alarming, and a lag of zero.
        $this->pdo->exec("UPDATE outbox SET status = 'published' WHERE aggregate_id = 'order-1'");
        $healthy = $this->health()->snapshot();

        $this->assertSame(1000, $healthy->pending);
        $this->assertLessThan(1.0, $healthy->oldestPendingAgeSeconds);
    }
The age of the oldest unpublished event is the lag every consumer of the outbox experiences, and it is the outbox's one real service-level indicator. Everything else is diagnosis. It is a maximum, not a distribution: percentiles of delivery latency are published_at - created_at, already in the table for whatever your dashboard can query, while the oldest age is the number that tells you the worst case is still growing. The full set comes from a single query over the unpublished rows:
// src/Monitoring/OutboxHealth.php
    public const string OUTBOX_SQL = <<<'SQL'
        SELECT
            count(*) FILTER (WHERE o.status = 'pending')                          AS pending,
            count(*) FILTER (WHERE o.status = 'pending' AND o.retry_since IS NOT NULL) AS retrying,
            count(*) FILTER (WHERE o.status = 'dead')                             AS dead,
            -- Pending rows that cannot move until a human acts: an earlier event of their
            -- aggregate is dead.
            count(*) FILTER (WHERE o.status = 'pending' AND EXISTS (
                SELECT 1 FROM outbox d
                WHERE d.aggregate_id = o.aggregate_id AND d.id < o.id AND d.status = 'dead'
            ))                                                                    AS held,
            count(DISTINCT o.aggregate_id) FILTER (WHERE o.status = 'dead')       AS parked_aggregates,
            coalesce(extract(epoch FROM now() - min(o.created_at) FILTER (WHERE o.status = 'pending')), 0)
                                                                                  AS oldest_pending_age_seconds
        FROM outbox o
        WHERE o.status <> 'published'
        SQL;
And that explains the demo's middle block: the lag was 7 seconds with nothing retrying because B paid was held. A held event is pending, so it ages, so the lag climbs for as long as its aggregate is parked. A dead event with nothing behind it does not move the lag at all. These are different failures with different owners, and they need different metrics.
Three design choices sit under the numbers:
The numbers are read from the tables at scrape time, not kept in the relay. A PHP relay is a process that gets restarted; an in-process counter resets with it, and with several relays each one only knows its own half. The gauges are a query. The counters — published, retried, dead-lettered, lease lost — are columns of a per-relay row in outbox_relay, incremented in the same transaction as the state change they count, so they cannot drift from the table and survive restarts. Each relay updates only its own row, so they add no contention between relays; the exporter sums them.
No labels. event_type as a label is tempting and turns a handful of series into hundreds; aggregate_id as a label would be a cardinality incident. The metrics say how much; bin/outbox dead-letters says which.
The relay sends a heartbeat at the start of every pass and before every publish, and outbox_relays_alive counts relays that beat in the last 30 seconds. Its id should be stable across restarts — a pod name, a slot — because every id gets a row whose counters the exporter sums forever. That metric exists for one scenario, covered in the next section, in which every other number on this list looks perfect.
The exporter itself is public/metrics.php, three lines that render the snapshot in the Prometheus text format. run.sh pipes its real output through promtool check metrics, which is the only check of the format that matters — the one Prometheus itself applies.
Alerts, and the tests for the alerts
Six rules, each answering a question the others cannot:
| alert | expression | severity | the question |
|---|---|---|---|
OutboxLagHigh | oldest_pending_age > 600 for 1m | page | are consumers too far behind? |
OutboxAggregateParked | held_rows > 0 for 15m | page | is an aggregate frozen behind a dead event? |
OutboxDeadLetter | dead_rows > 0 | ticket | is there an event someone has to decide about? |
OutboxRelayDown | relays_alive < 1 for 2m | page | is anything draining the outbox at all? |
OutboxLeaseLost | increase(lease_lost_total[1h]) > 3 | ticket | is the lease shorter than the broker's slow path? |
OutboxMetricsAbsent | absent(relays_alive) for 5m | page | is anything above even being evaluated? |
The lag threshold is not a round number someone liked. It is the outage you are willing to sit through plus the backoff cap, because the cap is lag you add after the broker comes back: an event that just drew a five-minute delay waits it out even if the broker recovered a second later. Five minutes tolerated plus a 300-second cap is 600 seconds. Set the threshold below the cap and the alert pages on every broker blip long enough to push one event to its capped delay — about nine failures in a row; change the cap without changing the threshold and you have quietly changed what pages. The rule carries that arithmetic in its comment:
# monitoring/alerts.yml
      # What consumers feel. The threshold is the outage you tolerate plus the backoff cap: after
      # the broker comes back, an event can still sit out one full capped delay before its next
      # try, and that wait is lag too. 5 minutes tolerated + 300 s cap = 600 s.
      - alert: OutboxLagHigh
        expr: outbox_oldest_pending_age_seconds > 600
        for: 1m
        labels:
          severity: page
        annotations:
          summary: 'Oldest unpublished event is {{ $value | humanizeDuration }} old'
OutboxRelayDown is the alert for three in the morning. The relay dies at midnight; nobody places an order until seven. All night the outbox is empty, so the lag is zero, nothing is dead, nothing is held — every outbox metric reads healthy, because there is nothing to be unhealthy about. At seven the first order is written and nobody publishes it. Lag alone notices at 7:11. The heartbeat notices before 0:03: thirty seconds for the last beat to age out, two minutes of for. Without it, the first signal is a customer.
OutboxMetricsAbsent covers the layer underneath: if the exporter is down, every expression above evaluates over nothing and stays silent, which is the worst possible moment for silence.
Alert rules are code that only runs during incidents, so they are the least tested code most teams own. Prometheus ships a unit-test runner for them, and monitoring/alerts.test.yml uses it for eight scenarios with fifteen evaluations. The three-in-the-morning one, in full:
# monitoring/alerts.test.yml
  # 3 a.m.: nothing pending, lag zero, and the only relay has stopped beating.
  - interval: 1m
    input_series:
      - series: outbox_oldest_pending_age_seconds
        values: '0x10'
      - series: outbox_relays_alive
        values: '1 1 1 0 0 0 0 0 0 0 0'
    alert_rule_test:
      - eval_time: 10m
        alertname: OutboxLagHigh
        exp_alerts: []
      - eval_time: 4m
        alertname: OutboxRelayDown
        exp_alerts: []
      - eval_time: 5m
        alertname: OutboxRelayDown
        exp_alerts:
          - exp_labels:
              severity: page
            exp_annotations:
              summary: 'No outbox relay has sent a heartbeat for 2 minutes'
The others assert the negative cases as carefully as the positive ones: a single event in backoff for five minutes does not page; a dead event with nothing behind it opens a ticket and does not page; one lost lease in an hour is a broker hiccup and stays quiet, five is a lease that is too short. The tests also caught one thing the author got wrong. The absent() rule was first tested to fire seven minutes after the last scrape, and it did not: the series only counts as missing after Prometheus' five-minute lookback, and then the for adds five more. It fires ten minutes after the exporter disappears, and the test now says so.
What this does not cover
The broker is scripted. The relay talks to an in-memory ScriptedBroker that fails on cue. That is what makes the failure paths testable to the second, and it is also why nothing here measures a real broker's latency, confirm semantics or failover behaviour. Writing the adapter for RabbitMQ, Kafka or SQS is mostly the classification table above, mapped onto that client's exceptions — and the claim in the interface docblock, that publish() returns only after a confirm, is the adapter's to keep.
Throughput is not measured. The planner test proves the hot queries avoid the published history; it does not say how many events per second this relay sustains, and the one-event-per-aggregate-per-claim rule caps a single hot aggregate at one event per poll. Part one's advice about partitioning a high-volume outbox still applies, and the partial indexes here assume the published rows are eventually deleted or partitioned away. The renewal has a price too: every publish now runs two more statements — the heartbeat and the renewal — before the verdict transaction it always had. If that matters more than a lapsed lease, renew only once half the lease has passed; the test for the batch lease will tell you whether the cheaper version still holds.
Polling, not change data capture. With Debezium the relay is Kafka Connect, and retry, dead letters and lag become its configuration and its metrics. The questions in this article stay the same; the answers move to another tool.
PHP 8.6 is a release candidate. The image is pinned to 8.6.0RC4 by digest. The only 8.6 feature the code depends on is Time\Duration; before durations replaced the integer seconds, the same suite ran green on 8.5.12.
How this was checked
The suite runs against a real PostgreSQL, and every mechanism in this article was then removed, one at a time, on a copy of the repository: mutations/run.py applies 29 such mutants and reports which test kills each one. 28 die, each on the test that describes it. The survivor removes the lease-owner check from a successful verdict, and it survives because it is equivalent — a late success marked by the old owner or the new one leaves the same duplicate and the same counts — while the same check on the failure path is killed.
That was not enough, and the way it was not enough is the most useful thing I can report about testing this kind of code. The first complete version had 33 green tests and 18 killed mutants, and an independent code review still found five defects in it: the lease stamped once per batch, the retry window measured from the insert, the ordering hole between insert and commit, a heartbeat that went quiet during long passes, and a counter that silently dropped increments for a relay that had not sent its first heartbeat. Reading the result again found two more: the shutdown that dead-letters healthy events, and a Docker image that was quietly running the host's dependencies instead of the locked ones. Every code defect among them now has a test that fails without its fix; the Docker one is fixed by a .dockerignore, and the README says how to check the image. Mutation testing proves that a mechanism exists and is exercised; it cannot tell you the mechanism is measuring the right thing. That takes someone asking what each number actually means — when does this window start, whose clock is this, what happens to the rows a stopping process holds.
The short version
Claim with a lease, renew it before every publish, and publish with no transaction open. Serialise the writers of one aggregate, or the ordering rule is checking ids that are not visible yet. Count the attempt when you claim it, so an event that kills the relay still runs out of chances — and release what you claimed when you are asked to stop, so a deploy does not look like a crash. Sort failures into permanent, transient and unexplained, and give each the budget its evidence deserves: none, a window of time, and a small count. Back off with full jitter, and bound transient retries by how long they have been failing, not by how many times you tried or how old the event is — a count limit of five dead-letters healthy events eleven seconds into an outage. Let a stuck event hold its own aggregate and no other, and give the dead letters an owner and a requeue.
Then measure the age of the oldest unpublished event, not the size of the backlog; count held events separately from dead ones; send a heartbeat, because at three in the morning it is the only metric that can be wrong; and test the alert rules like the code they are.